Metrics
Publish aggregate throughput, latency, and error telemetry for Prometheus-oriented monitoring.
Always confirm availability in the release bundle selected for deployment.
At a glance
| Property | Value |
|---|---|
| Pipeline phase | Request + response |
| Category | Observability |
| Canonical minimum tier | Free |
| Canonical entitlement | Yes |
| Supported deployment contract | Yes |
| Release status | Catalog component. |
Release accuracy
- Current documentation: Catalog component.
Where any detail below conflicts with the release status above, the release status is authoritative. Field names and examples describe the current dashboard and CRD surface; always confirm behavior against the selected release bundle before relying on it operationally.
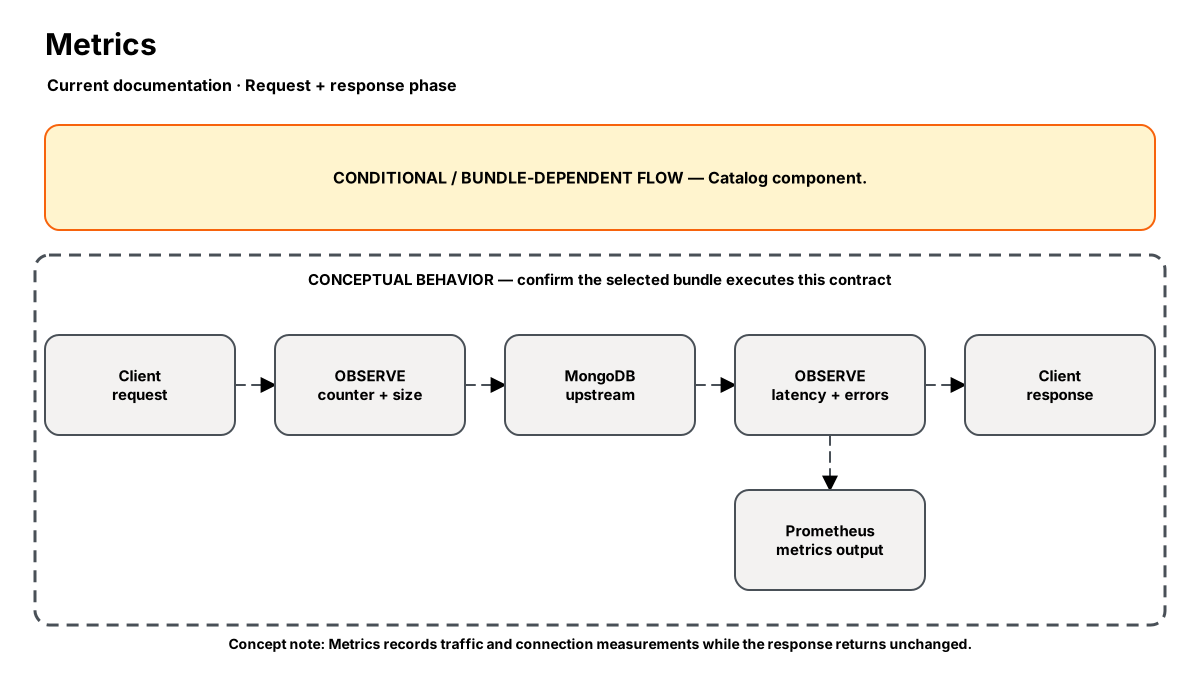
Release-aware feature flow. The diagram is explanatory; the release status on this page is authoritative.
Diagram resources: Open the SVG full screen · Download the editable Excalidraw source
Performance impact
:::warning Unverified performance figures
These figures are illustrative only. They are not current benchmarks or service guarantees and have not been verified by the current test suite.
:::
| Percentile | Reported figure |
|---|---|
| P50 | 0.08ms |
| P95 | 0.15ms |
| P99 | 0.30ms |
Note: In-memory counter updates. No I/O on hot path.
Overview
The Metrics step instruments every MongoDB operation with Prometheus counters, histograms, and gauges. It exposes request rate, latency distribution, error rate, and active connections — broken down by command type, database, and collection.
Metrics are exported via the standard /metrics HTTP endpoint (port 9090) and are compatible with Prometheus, Grafana, Datadog, and any OpenMetrics scraper.
When to use
- Monitoring MongoDB traffic throughput and latency in real-time
- Setting up alerts on error rate spikes or latency degradation
- Capacity planning based on actual traffic patterns
- Building Grafana dashboards for MongoDB operational visibility
How it works
- Request phase: Increments
nexo_requests_totalcounter with labels (command, db, collection). Records request size innexo_request_size_byteshistogram. - Response phase: Records latency in
nexo_request_duration_secondshistogram. Incrementsnexo_errors_totalif the response indicates failure. - Maintains
nexo_active_connectionsgauge for concurrent connection tracking.
Configuration
“Not specified” means required semantics were not declared for that field.
| Field | Type | Default | Required | Description |
|---|---|---|---|---|
histogram_buckets | string | 1,5,10,25,50,100,250,500,1000,5000 | No | Custom latency histogram buckets (comma-separated ms values) |
include_collection | bool | true | No | Add collection label to metrics (high cardinality warning) |
namespace | string | nexo | No | Prometheus metric prefix |
Settings reference
No additional settings reference is documented for this component.
Examples
Default metrics collection
steps:
  - name: builtin:metrics
    config:
      include_collection: true
      namespace: nexo
Best practices
- Keep
include_collection: trueunless you have >1000 collections (cardinality explosion) - Use pre-built Grafana dashboards from the Nexo marketplace
- Set alerts on
nexo_errors_totalrate andnexo_request_duration_secondsp99
Limitations
- Collection-level labels can cause high memory usage with many collections
- Only tracks OP_MSG operations (MongoDB 3.6+ wire protocol)
Security and operational guidance
- Do not place raw query payloads in labels
- Keep customer-controlled labels bounded
- Treat metrics endpoints as operationally sensitive
Related steps
Release availability
- Current documentation: Catalog component.
See the component catalog for the complete comparison matrix.