Index Advisor
Analyze sampled query behavior, detect expensive patterns, and produce index recommendations.
Always confirm availability in the release bundle selected for deployment.
At a glance
| Property | Value |
|---|---|
| Pipeline phase | Request + response |
| Category | Performance |
| Canonical minimum tier | Free |
| Canonical entitlement | Yes |
| Supported deployment contract | Yes |
| Release status | Catalog component. The dashboard currently displays an incorrect Business badge; canonical entitlement is Free. |
Release accuracy
- Current documentation: Catalog component. The dashboard currently displays an incorrect Business badge; canonical entitlement is Free.
Where any detail below conflicts with the release status above, the release status is authoritative. Field names and examples describe the current dashboard and CRD surface; always confirm behavior against the selected release bundle before relying on it operationally.
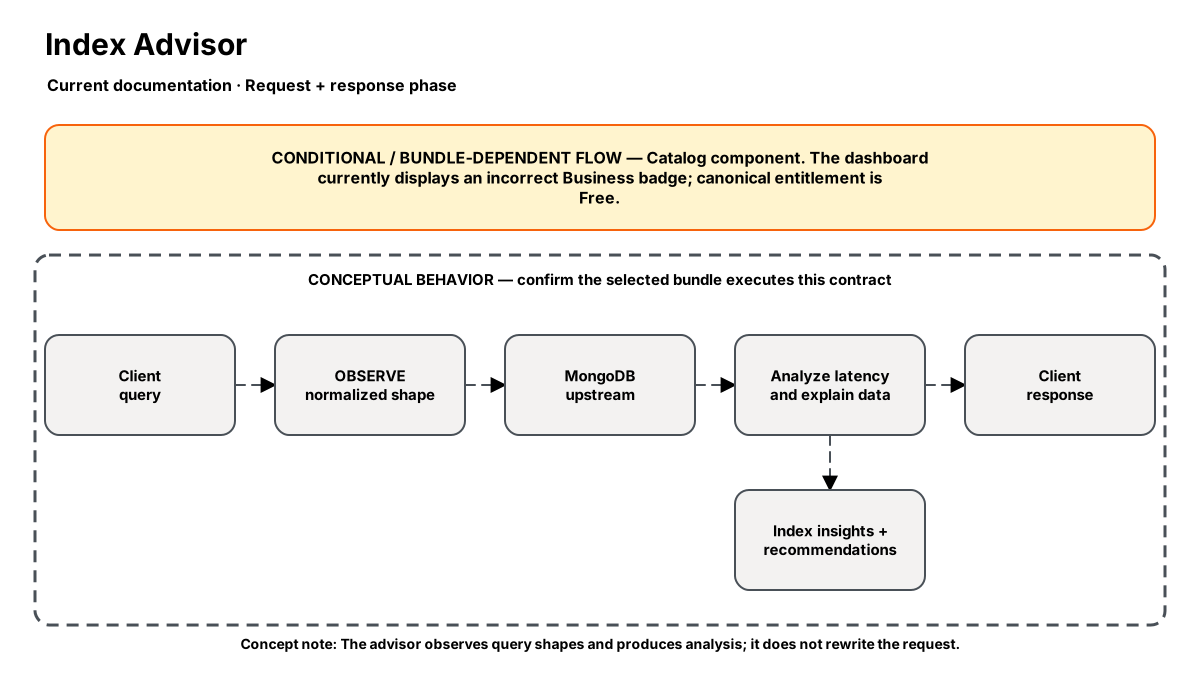
Release-aware feature flow. The diagram is explanatory; the release status on this page is authoritative.
Diagram resources: Open the SVG full screen · Download the editable Excalidraw source
Performance impact
:::warning Unverified performance figures
These figures are illustrative only. They are not current benchmarks or service guarantees and have not been verified by the current test suite.
:::
| Percentile | Reported figure |
|---|---|
| P50 | <0.2ms |
| P95 | <0.5ms |
| P99 | <1ms |
Note: Query-shape extraction is in-process; explain runs happen asynchronously on the scheduler.
Overview
Index Advisor samples MongoDB queries, extracts their filter/sort/projection shape, tracks latency and frequency, persists the resulting patterns, and turns that data into index recommendations. Higher tiers add estimated scan cost ratios, duplicate-index detection, scheduled explain analysis, and index usage visibility.
When to use
- Find missing indexes from production traffic without enabling the database profiler
- Prioritize high-impact query patterns using frequency, latency, and estimated scan cost
- Continuously explain the hottest patterns in the background
- Detect redundant prefix indexes and see which suggested/observed indexes are unused
How it works
- ProcessRequest samples supported OP_MSG query commands and extracts filter, sort, and projection keys into a normalized query shape.
- ProcessResponse correlates the shape with elapsed time, increments the matching QueryPattern, and optionally computes estimated_cost_ratio.
- A flush loop periodically persists patterns to MongoDB storage; auto_explain can run a separate scheduler that explains the top-N patterns on a configurable interval.
- Explain results annotate each pattern with explain_result, winning_plan, index_used, and last_explain.
- Recommendations are built from the observed key order, DetectDuplicates finds prefix-redundant indexes, and IndexUsage summarizes used versus unused observed/suggested indexes.
Configuration
“Not specified” means required semantics were not declared for that field.
| Field | Type | Default | Required | Description |
|---|---|---|---|---|
sample_rate | percentage | 100 | Not specified | Percentage of supported queries to observe |
min_query_time_ms | number | 0 | Not specified | Ignore patterns faster than this threshold |
flush_interval_sec | number | 30 | Not specified | How often patterns are flushed to storage |
storage_db | string | nexo_internal | Not specified | MongoDB database used for pattern storage |
storage_collection | string | index_patterns | Not specified | MongoDB collection used for pattern storage |
ttl_days | number | 30 | Not specified | Optional TTL for stored patterns |
exclude_collections | json | — | No | Collections to skip |
exclude_databases | json | — | No | Additional databases to skip |
cost_estimation | json | — | No | Pro: {enabled} |
detect_duplicates | json | — | No | Pro: {enabled} |
auto_explain | json | — | No | Business: {enabled, interval_sec, top_n} |
usage_tracking | json | — | No | Business: {enabled} |
Settings reference
No additional settings reference is documented for this component.
Examples
Pro tier advisor with cost estimation and duplicate detection
steps:
  - name: builtin:index-advisor
    config:
      sample_rate: 100
      min_query_time_ms: 50
      flush_interval_sec: 30
      storage_db: nexo_internal
      storage_collection: index_patterns
      ttl_days: 14
      exclude_collections:
        - system.profile
      cost_estimation:
        enabled: true
      detect_duplicates:
        enabled: true
Business tier advisor with scheduled explain and usage tracking
steps:
  - name: builtin:index-advisor
    config:
      sample_rate: 25
      min_query_time_ms: 100
      flush_interval_sec: 60
      storage_db: nexo_internal
      storage_collection: index_patterns
      auto_explain:
        enabled: true
        interval_sec: 900
        top_n: 20
      usage_tracking:
        enabled: true
      webhook_url: https://hooks.slack.com/services/xxx
      report_interval: 4h
Best practices
- Start with a lower sample_rate on very high-QPS clusters, then increase once storage volume is understood
- Use auto_explain on a cadence that your cluster can tolerate and keep top_n focused on the hottest patterns
- Review DetectDuplicates output before dropping an index; confirm workload coverage first
- Use usage_tracking alongside recommendations to distinguish truly used indexes from unused candidates
Limitations
- The advisor derives recommended indexes from observed key order; it does not model every MongoDB planner nuance
- IndexUsage reports observed used indexes plus unused suggested shapes, not a full catalog dump from the cluster
- Explain scheduling requires the step to have storage/cluster connectivity so background explain commands can run
Security and operational guidance
- Recommendations require operator review before any index change
- Review storage, write amplification, and index build load
- The current component contract does not expose automatic index creation
Related steps
Release availability
- Current documentation: Catalog component. The dashboard currently displays an incorrect Business badge; canonical entitlement is Free.
See the component catalog for the complete comparison matrix.