Metrics
Publish aggregate throughput, latency, and error telemetry for Prometheus-oriented monitoring.
This page belongs to the immutable 0.2.0 Private Preview documentation.
At a glance
| Property | Value |
|---|---|
| Pipeline phase | Request + response |
| Category | Observability |
| Canonical minimum tier | Free |
| Legacy dashboard tier label | Free |
| Legacy rendered name | Metrics |
| Legacy rendered summary | Prometheus-compatible metrics for MongoDB traffic: throughput, latency, errors. |
| Canonical entitlement | Yes |
| Supported deployment contract | Yes |
| Release status | Reconciled and executable. |
Release accuracy
- 0.2.0 Private Preview: Reconciled and executable.
The detailed material below preserves every section rendered by the legacy dashboard. Where it conflicts with the release status above, the release status is authoritative. Legacy field names and examples are not a substitute for the selected bundle's CRD and runtime contract. Unsafe legacy wording is retained in metadata for traceability but is corrected in the rendered guidance.
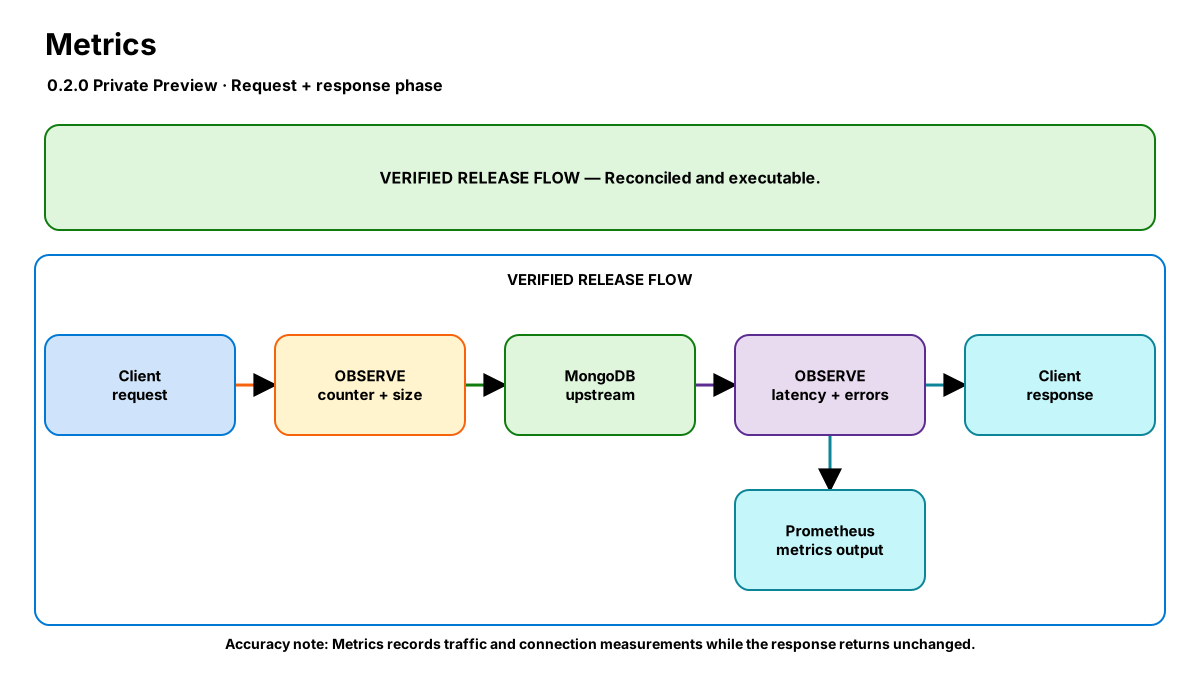
Release-aware feature flow. The diagram is explanatory; the release status on this page is authoritative.
Diagram resources: Open the SVG full screen · Download the editable Excalidraw source
Performance impact
:::warning Legacy, unverified performance claims
These numbers are preserved for documentation parity with the legacy dashboard. They are not current benchmarks or service guarantees and have not been verified by the current test suite.
:::
| Percentile | Legacy claim |
|---|---|
| P50 | 0.08ms |
| P95 | 0.15ms |
| P99 | 0.30ms |
Legacy note: In-memory counter updates. No I/O on hot path.
Overview
The Metrics step instruments every MongoDB operation with Prometheus counters, histograms, and gauges. It exposes request rate, latency distribution, error rate, and active connections — broken down by command type, database, and collection.
Metrics are exported via the standard /metrics HTTP endpoint (port 9090) and are compatible with Prometheus, Grafana, Datadog, and any OpenMetrics scraper.
When to use
- Monitoring MongoDB traffic throughput and latency in real-time
- Setting up alerts on error rate spikes or latency degradation
- Capacity planning based on actual traffic patterns
- Building Grafana dashboards for MongoDB operational visibility
How it works
- Request phase: Increments
nexo_requests_totalcounter with labels (command, db, collection). Records request size innexo_request_size_byteshistogram. - Response phase: Records latency in
nexo_request_duration_secondshistogram. Incrementsnexo_errors_totalif the response indicates failure. - Maintains
nexo_active_connectionsgauge for concurrent connection tracking.
Configuration
The table preserves the legacy dashboard field reference. “Not specified” means the legacy source did not declare required semantics.
| Field | Legacy UI type | Legacy default | Required | Description |
|---|---|---|---|---|
histogram_buckets | string | 1,5,10,25,50,100,250,500,1000,5000 | No | Custom latency histogram buckets (comma-separated ms values) |
include_collection | bool | true | No | Add collection label to metrics (high cardinality warning) |
namespace | string | nexo | No | Prometheus metric prefix |
Settings reference
The legacy page did not render an additional anchored settings reference.
Examples
Default metrics collection
steps:
  - name: builtin:metrics
    config:
      include_collection: true
      namespace: nexo
Best practices
- Keep
include_collection: trueunless you have >1000 collections (cardinality explosion) - Use pre-built Grafana dashboards from the Nexo marketplace
- Set alerts on
nexo_errors_totalrate andnexo_request_duration_secondsp99
Limitations
- Collection-level labels can cause high memory usage with many collections
- Only tracks OP_MSG operations (MongoDB 3.6+ wire protocol)
Security and operational guidance
- Do not place raw query payloads in labels
- Keep customer-controlled labels bounded
- Treat metrics endpoints as operationally sensitive
Related steps
Release availability
- 0.2.0 Private Preview: Reconciled and executable.
See the component catalog for the complete comparison matrix.