Logging
Emit structured records for MongoDB operations and configured request or response outcomes.
This page belongs to the immutable 0.2.0 Private Preview documentation.
At a glance
| Property | Value |
|---|---|
| Pipeline phase | Request + response |
| Category | Observability |
| Canonical minimum tier | Free |
| Legacy dashboard tier label | Free |
| Legacy rendered name | Logging |
| Legacy rendered summary | Structured request/response logging with configurable verbosity levels. |
| Canonical entitlement | Yes |
| Supported deployment contract | Yes |
| Release status | Reconciled and executable. |
Release accuracy
- 0.2.0 Private Preview: Reconciled and executable.
The detailed material below preserves every section rendered by the legacy dashboard. Where it conflicts with the release status above, the release status is authoritative. Legacy field names and examples are not a substitute for the selected bundle's CRD and runtime contract. Unsafe legacy wording is retained in metadata for traceability but is corrected in the rendered guidance.
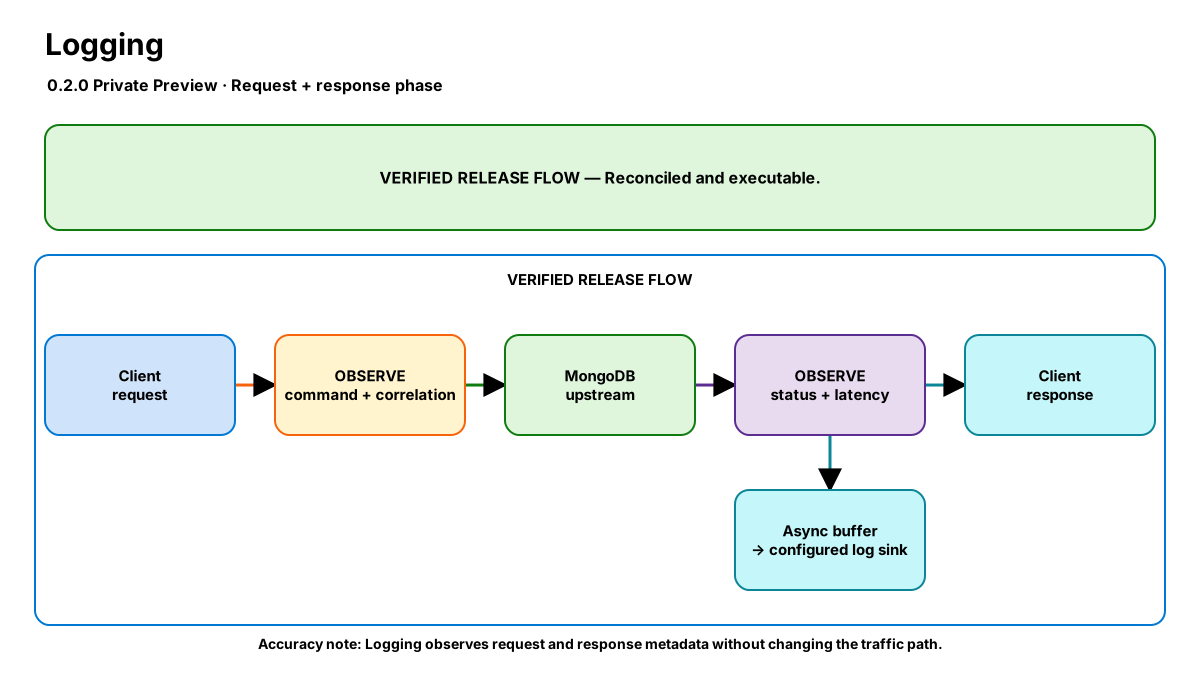
Release-aware feature flow. The diagram is explanatory; the release status on this page is authoritative.
Diagram resources: Open the SVG full screen · Download the editable Excalidraw source
Performance impact
:::warning Legacy, unverified performance claims
These numbers are preserved for documentation parity with the legacy dashboard. They are not current benchmarks or service guarantees and have not been verified by the current test suite.
:::
| Percentile | Legacy claim |
|---|---|
| P50 | 0.05ms |
| P95 | 0.12ms |
| P99 | 0.25ms |
Legacy note: Async writer — does not block request path. Body logging adds ~0.3ms for BSON serialization.
Overview
The Logging step captures MongoDB wire protocol operations as structured log entries. It intercepts both request and response phases, extracting command metadata (operation type, collection, database, duration) and emitting JSON-structured logs to your configured sink.
Logs are written asynchronously via a buffered channel to minimize impact on request latency. The step supports multiple output formats (JSON, logfmt) and integrates with standard observability stacks (ELK, Loki, Datadog).
When to use
- Debugging query patterns in development or staging
- Auditing database access (lightweight, non-immutable — see Audit step for compliance)
- Understanding traffic patterns before optimizing
- Troubleshooting slow queries by correlating with response times
How it works
- Request phase: Extracts command name, database, collection, and document count from the OP_MSG body. Emits a "request" log entry with a correlation ID.
- Response phase: Captures response status (ok/error), document count, and elapsed time. Emits a "response" log entry with the same correlation ID.
- Logs are pushed to an async ring buffer (default 8192 entries) and flushed by a background writer every 100ms or when the buffer reaches 75% capacity.
Configuration
The table preserves the legacy dashboard field reference. “Not specified” means the legacy source did not declare required semantics.
| Field | Legacy UI type | Legacy default | Required | Description |
|---|---|---|---|---|
level | select | info | No | Minimum log level to emit |
format | select | json | No | Output format: json or logfmt |
include_body | bool | false | No | Include the full BSON document body in logs (expensive) |
sample_rate | percentage | 100 | No | Percentage of requests to log (1-100) |
output | select | stdout | No | Log destination: stdout, file, or syslog |
Settings reference
The legacy page did not render an additional anchored settings reference.
Examples
Basic JSON logging (all traffic)
steps:
  - name: builtin:logging
    config:
      level: info
      format: json
      include_body: false
      sample_rate: 100
Sampled debug logging (10%)
steps:
  - name: builtin:logging
    config:
      level: debug
      format: json
      include_body: true
      sample_rate: 10
Best practices
- Start with
include_body: falsein production — body serialization adds latency and storage cost - Use
sample_rate: 10-25for high-throughput services to reduce log volume - Pair with the Metrics step for quantitative monitoring; use Logging for qualitative debugging
- Set level to
warnin production,debugin staging
Limitations
- Not suitable for compliance/SOC2 — use Audit only as tamper-evident evidence when HMAC signing is enabled; immutability requires external immutable storage
- Body logging only works for OP_MSG format (MongoDB 3.6+)
- Log buffer can drop entries under extreme load (>50K req/s) — monitor
nexo_log_drops_totalmetric
Security and operational guidance
- Keep body capture disabled unless required
- BSON bodies may contain credentials, tokens, personal data, and customer documents
- Apply redaction, access control, encryption, and retention to every destination
- The preserved legacy claim that Audit is immutable and tamper-proof is inaccurate: HMAC signing is tamper-evident only, and immutability requires external immutable storage.
Related steps
Release availability
- 0.2.0 Private Preview: Reconciled and executable.
See the component catalog for the complete comparison matrix.